Investments
See also:
The dollar ($) has been used in these examples, but any other currency (€, £, F, ¥, R, DA, Rs… etc.) may be used.
Most of the calculations below may use Fixed (unique interest rates) or Variable rates.
Real-life examples:
Stock market return vs. Treasuries
Annual Rate of return in complex situations (irregular investments and payouts)
Future value of regular and irregular periodic investments over time
Present value of an investment providing projected future returns (annuities)
Stock market return vs. Treasuries
Margill can easily demonstrate the difference between the return obtained in the Stock market versus, for example, an investment in Treasuries or other conventional market instrument.
For example, as a financial planner, you wish to show to your clients that they should invest in the riskier Stock market as opposed to Treasuries. This is a known fact of course but a concrete example always does the trick.
If your clients had invested $5000 in 1994 in US Treasuries (lets say US Federal Reserve rates + 1.5%)(any other variable interest rates could be used or a fixed rate of 6% for example) versus the same investment in the Dow Jones index – or any other mutual fund or index. What would be the value of this investment 10 years later?
Data input screen using the Fed Funds rates + 1,5%
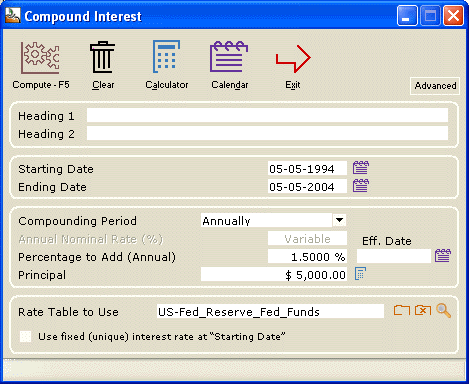
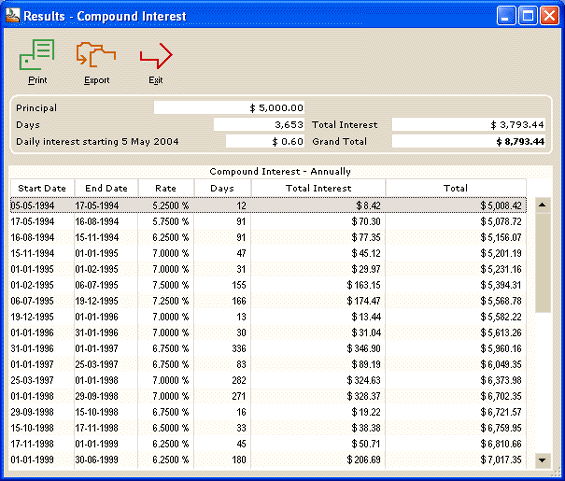
Value in 2004 at the Federal reserve rate + 1,5% (compounded annually):
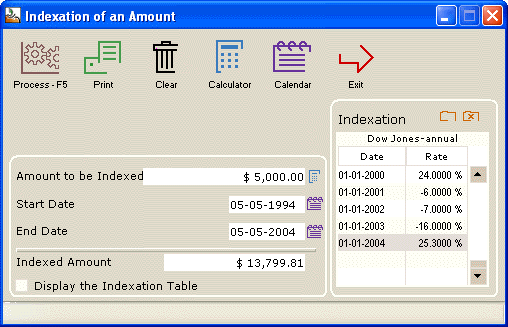
Value in 2004 in the Dow Jones index:
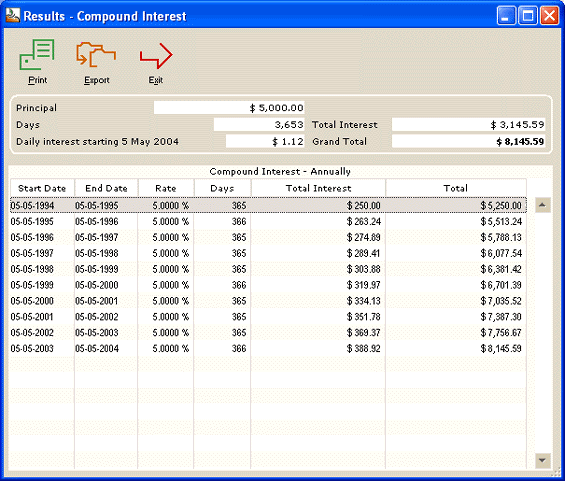
Value in 2004 of an investment at fixed 6%:
Your clients are now convinced, they would have made over $5000 more by an investment in the stock market than in a “safer” investment.
Annual Rate of return
What is the rate of return of the above investments?
Our Fed funds + 1.5% provides the following annual return:
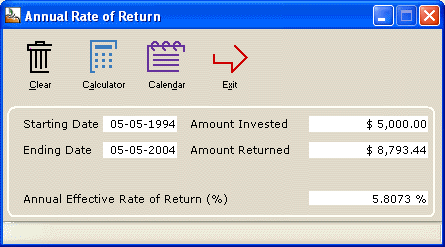
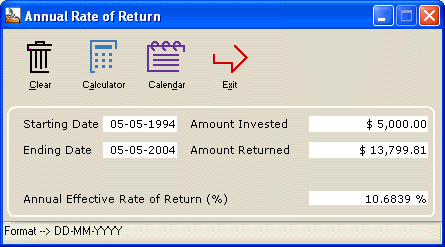
The Dow Jones investment offers almost double that return:
Annual Rate of return in complex situations (irregular investments and payouts)
An investor invests $2,000,000 on July 1, 2003. He does regular monthly withdrawals of $5000 on the 10th of each month starting on September 10, 2003. He invests $330,000 on March 25, 2004 and another investment of $150,000 on November 1, 2004. He also withdraws lump sums of $10,500 on January 1st of 2004, 2005 and 2006. The net value of the total investment on February 1, 2006 is $2,850,000.
What was the annual return on the investment?
First enter the preliminary information:
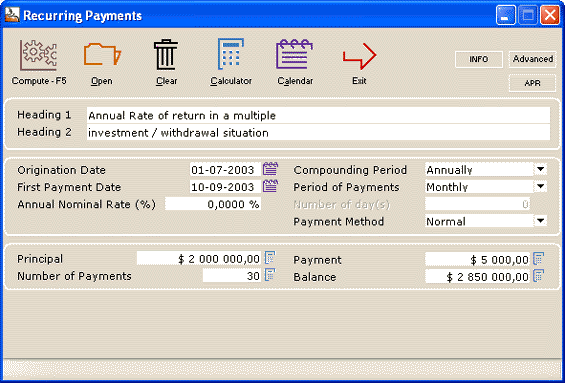
A preliminary regular schedule is produced after “Compute”. This gives us a rough idea of the return but excludes the various investments and irregular withdrawals and the exact final date.
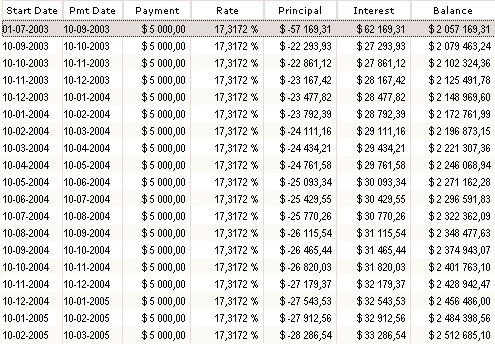
We then adapt the schedule to fit our needs.
The lines in gray have been added with the “Inserts a line in the table” icon (at the right of the table (not shown in this example)). ![]()
A positive amount is a withdrawal and a negative amount is a new investment. We see below some of the events. Any other investment or withdrawal could have been added.
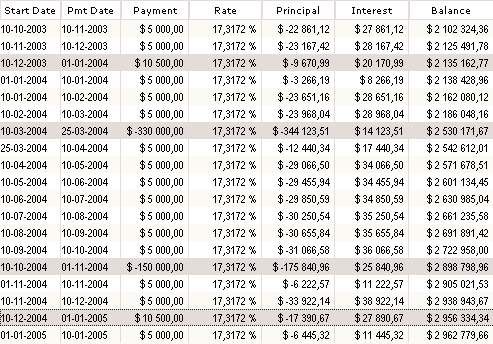
Once the schedule is created to suit our needs, we must then calculate the new interest rate, thus the Annual Rate of return.
Very simple to do… Select all lines, right click with the mouse to recalculate the annual interest rate:
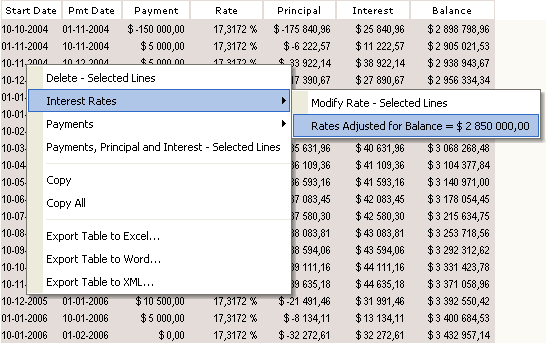
Margill will automatically calculate the annual interest rate (compounded annually) for the whole investment.
The Annual Rate of return is thus 8.8967% (see complete Results below):
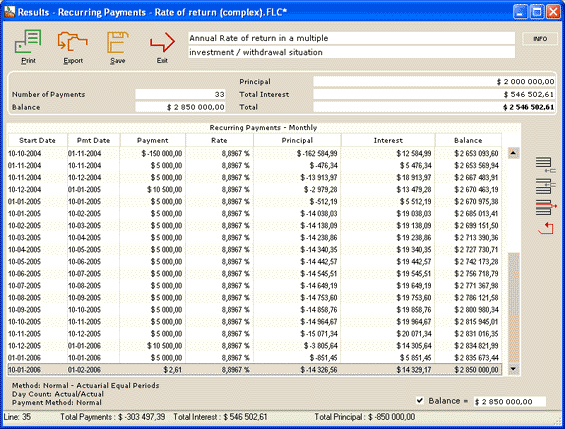
This can also be saved and changed over time…
Future value of regular and irregular periodic investments over time
An investor wishes to invest $2000 per month, every month for 3 years. The interest rate is 6% compounded upon every payment. What will be the future value in 3 years time? Also, an extra $2500 is invested every January 1st.
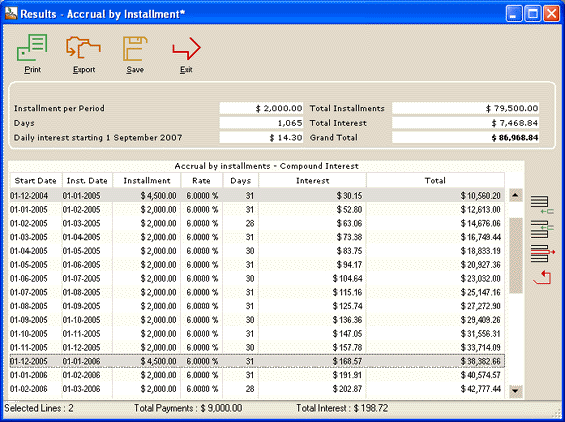
Comparisons are also possible if the rate is to vary over time. This can be changed in the installment schedule in a snap (select the lines, right click and change the rate – all is recalculated automatically). In our example, the rate is at 6% in 2004, then 7.5% in 2005, 8% in 2006 and 8.5% for the remaining months in 2007.
Here are the last payments of the schedule :
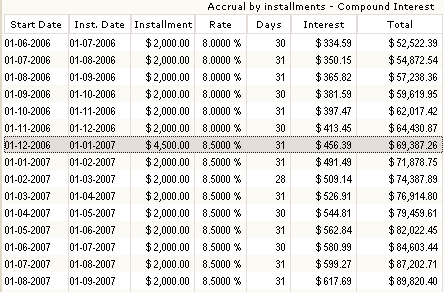
The “Accrual by Installment” calculation also allows to add new irregular installments at any point in time in the schedule using the icons to the right of the schedule
![]()
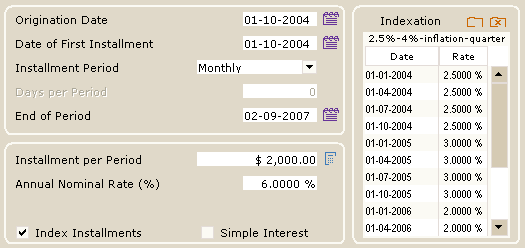
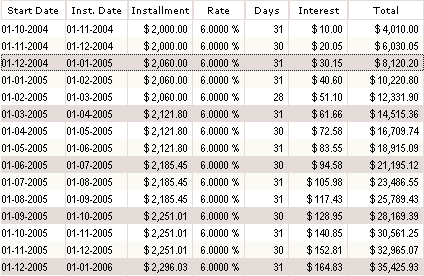
A powerful function of this calculation is the indexation function by which an indexation table is used to index the future (or historic) installments. In this example, the installments are indexed at various rates every quarter. Simply build the indexation table to obtain the exact numbers. In this example, the rates are 2.5% per quarter in 2004, 3,0% per quarter in 2005, 2.0% in 2006 and so on.
The new installment table created automatically adjusts the installments and the total future value is calculated:
Present value of an investment providing projected future returns (annuities)
What is the maximum initial amount that should be paid today to generate guaranteed future cash flows (annuities)?
For example, for a $75 000 investment today, a fund guarantees $2500 in monthly revenue starting in 10 years for the 20 years that will follow. Is the investment worth the price?
There is no easy answer. This will depend on the annual return you can obtain right now on this investment under a different investment option.
If you can only get 5% return, then this may be a good investment (but the risk is probably higher depending on who offers the annuity).
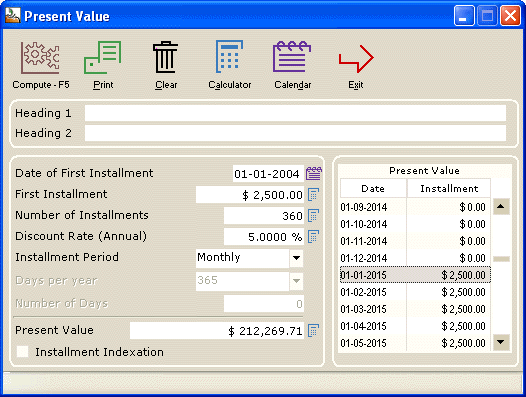
If you wish for a 20% return, then the initial investment is greatly overpriced.
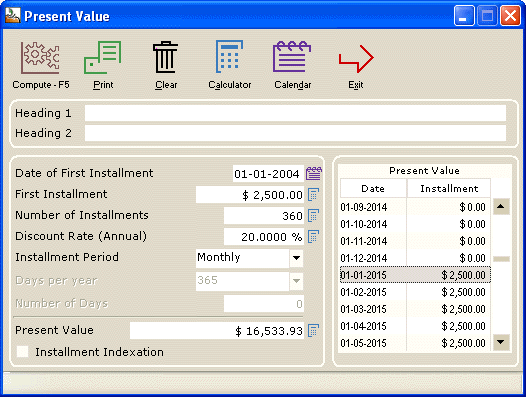
Margill allows you to try different hypotheses.
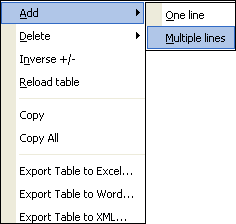
The right mouse click provides a quick method for producing special present value calculations. Many installment amounts may be changed or many new installments added in a second.
|
Right click functions when one line of the results is selected
|
Right click functions when multiple lines are selected
|
 |
